
Aug 7, 2026
Updated
Written by Gregory Shein, CEO & Founder
Project Profitability Tracking: Read Time, Cost and Billing Together
Review a project's delivery economics with a worked example, clear report definitions and a weekly checklist. Keep rate-based estimates, invoice totals and payments separate.
A project can have a healthy-looking invoice and still cost too much to deliver. It can also show a positive billing value in a time report before anyone has created an invoice. A useful profitability review starts by identifying what each number measures.
This walkthrough uses Northstar delivery review (Demo), a fictional engagement for Northstar Studio (Demo). The calculation uses 8 recorded hours, a $50 hourly cost rate, a $125 hourly bill rate and a $100 direct expense. It is separate from the earlier consultant lead-to-invoice example.
The time report supplies hours and rate-based values. An editorial calculation then compares those values with the direct expense. That calculation is not a native margin field, a client payment or the business's net profit.
1. Set the scope of the review
Write down the project, reporting period, currency and billing basis before collecting numbers. An hourly engagement, a fixed-price project and a recurring fee can all have the same recorded hours but different revenue.
For this example:
| Input | Value | Meaning |
|---|---|---|
| Project | Northstar delivery review (Demo) | The engagement being reviewed |
| Recorded work | 8 hours | Time assigned to this project |
| Hourly cost rate | $50 | Configured labor-cost input for the example |
| Hourly bill rate | $125 | Rate used to value the recorded hours |
| Direct expense | $100 | A separate project expense |
| Currency | USD | All calculation inputs use the same currency |
The $50 rate is an illustrative cost input. It is not evidence of payroll paid, and it does not automatically include benefits, employer taxes or overhead. Define what your own cost rate includes so you do not omit a cost or subtract it twice.
For fixed-price work, start from the agreed fee and its scope. Do not replace that fee with hours multiplied by an hourly bill rate. The project profitability calculator can help model a separate scenario before quoting.
2. Check the recorded time and rates
In Corcava's Reports, select the relevant date range and project. Grouping by task or member helps trace a total back to the work that produced it. Check that the selection contains the intended intervals, that the timezone matches the review period and that unrelated client projects are excluded.
Review the cost and bill rates effective for that work. The report uses dated rate records; a missing or unintended rate can make the result misleading. Cost calculation uses the applicable project cost rate, with a basic pay-rate fallback. Missing rates can produce zero values. Zero cost should trigger a configuration check, not a conclusion that delivery was free.
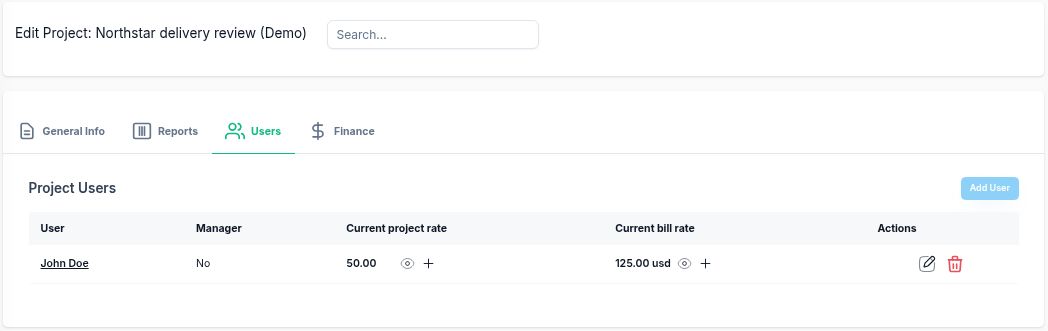
The project Users tab shows the configured $50 cost rate and $125 bill rate for John Doe. Check their effective dates before reviewing recorded work.

The fictional delivery review has one completed manual entry totaling 8 hours, assigned to the project.
For the Northstar inputs, the report arithmetic is:
Recorded hours = 8
Total Spent    = 8 × $50  = $400
Billed amount  = 8 × $125 = $1,000
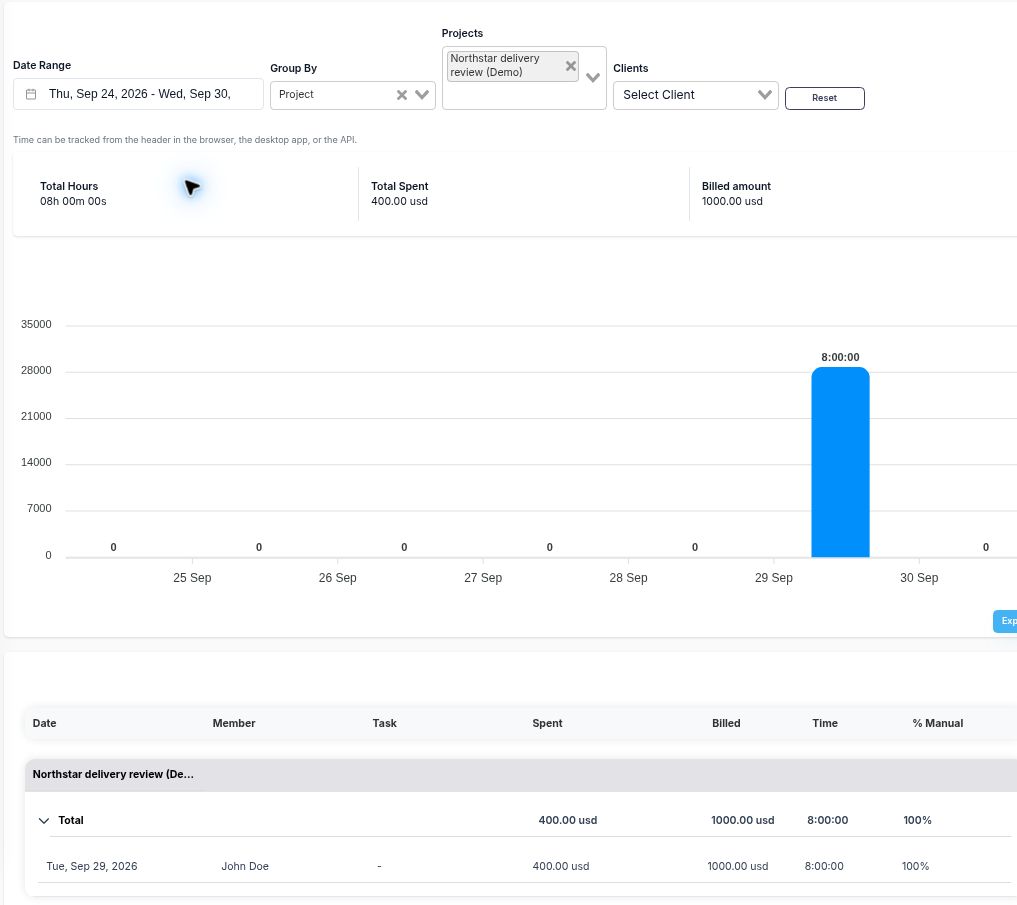
The selected project's 8 hours produce $400 Total Spent and $1,000 Billed amount. These are time-and-rate calculations.
“Billed amount” here means recorded hours valued at the applicable bill rate. It does not establish that an invoice exists, was sent, was accepted or was paid. Similarly, Total Spent values recorded work at cost rates; it is not a bank transaction.
This distinction matters when reviewing reporting alongside invoicing. A billing value, an invoice total and a payment can describe the same engagement while representing different stages and different amounts.
3. Add the direct expense once
The $100 expense is separate from the time report's $400 labor-cost value. Include it in this delivery review once, with a description and source record so another reviewer can check it.
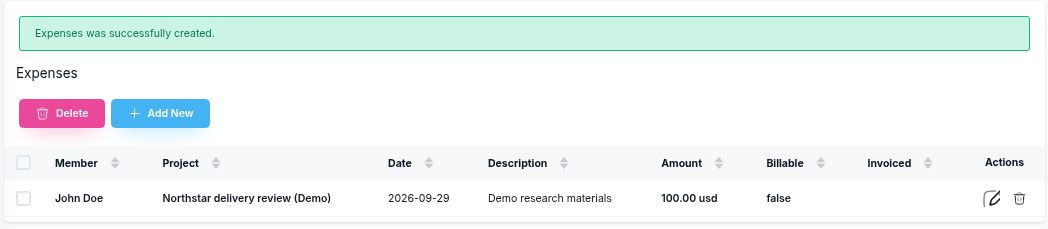
Demo research materials is a $100 project expense, recorded as non-billable with no invoice link. It is not added to the $1,000 client invoice.
The demo expense was recorded after the client invoice was created. When generating invoice line items, review expense inclusion: the non-billable flag does not automatically exclude an uninvoiced expense.
Use the following calculation only with its stated basis:
| Calculation | Amount |
|---|---|
| Rate-based value of 8 hours | $1,000 |
| Less modeled labor cost | −$400 |
| Less direct expense | −$100 |
| Modeled delivery contribution | $500 |
| Contribution as a share of rate-based value | 50% |
Modeled contribution = $1,000 − $400 − $100 = $500
Modeled contribution percentage = $500 ÷ $1,000 × 100 = 50%
This is an editorial calculation from the listed inputs, not a margin displayed by Corcava. It excludes overhead, taxes, write-offs and any unrecorded delivery work. The $1,000 starting value is not proof of recognized revenue or cash collected. If you need an actual-revenue margin, reconcile the revenue amount and period with your accounting records first.
A useful review names the remaining work too. The current cost only covers time already recorded. Estimate the cost of unfinished deliverables separately, then update the forecast when the scope or estimate changes. Counting completed tasks is not a substitute for estimating remaining effort: one unfinished task can take longer than several completed tasks together.
4. Reconcile Project Finances without double-counting
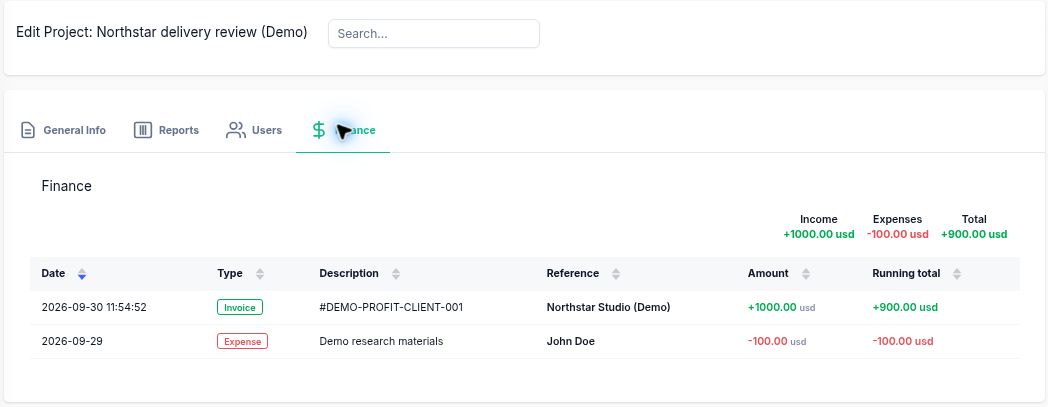
Project Finances answers a different question from the time report. Its ledger uses the full totals of linked client invoices, subtracts linked team invoices and subtracts project expenses. It does not automatically add the time report's modeled labor cost.
In this demo, client invoice DEMO-PROFIT-CLIENT-001 totals $1,000 and has $0 paid. Its status is Sent, set through a status-only action without sending an invoice email. No team invoice was created for the demo's $400 labor cost.
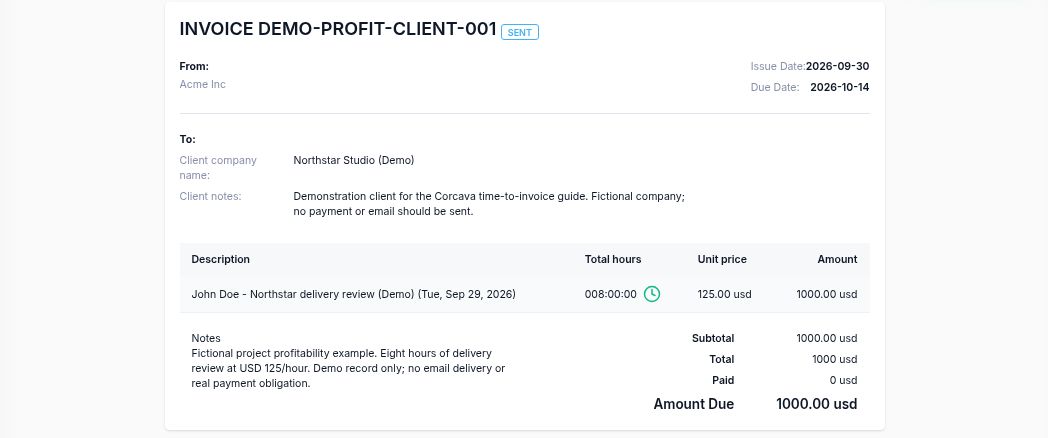
The invoice shows $1,000 total and $1,000 due. Its Sent status does not establish payment; the paid amount remains $0.
With the linked client invoice and the $100 expense, the Finance totals have this basis:
| Finance label | Included records | Amount |
|---|---|---|
| Income | Linked client invoice | $1,000 |
| Expenses | Direct project expense | $100 |
| Total | Invoice amount minus expense | $900 |
Finance contains two rows: the linked client invoice and the direct expense. The $400 time-based labor cost is not a ledger row.
The $900 Finance Total is not this project's profit. The report's $400 labor-cost value is absent from that ledger. Including that modeled labor cost once gives the separate $500 contribution calculated above. The 50% contribution percentage is also calculated separately; it is not a native Finance field.
An invoice linked to several projects appears at its full amount in each project's ledger. It is not allocated by that project's share of hours. Use single-project invoices for a simple review, or reconcile and allocate shared invoices separately before comparing or adding project totals. The Finance ledger also does not inherit the date range selected in Reports.
Invoice totals in that ledger are not filtered into cash receipts by payment status. A draft invoice can therefore affect a financial total without representing money collected. Check each linked record and its status before interpreting the balance.
When combining these sources, choose one cost basis for each piece of work. Where permissions allow team invoicing, a linked team invoice can represent labor cost in the ledger. If it covers the same labor you already modeled at $50 per hour, subtracting both would count that labor twice. Likewise, an expense shown separately and in the ledger is still one expense.
For a fixed-price estimate, creating its draft invoice does not consume tracked-time entries or directly connect those intervals to the invoice. The lead-to-invoice walkthrough shows why one agreed billing basis should guide invoice creation. Keep invoice balances and payments in a separate invoice-tracking review.
5. Turn the review into a decision
A useful weekly review produces an action, not just a percentage. Ask what changed since the previous review:
- More recorded work: was it planned delivery, rework or additional scope?
- Different rate-based values: did hours change, or did a rate or effective date change?
- A new expense: is it included once and allocated to the correct engagement?
- A billing gap: is the work eligible for invoicing under the agreement, or already covered by a fixed fee?
- More work remaining: does the forecast still fit the agreed scope and fee?
Use a change request to document proposed extra work, price and timing before treating it as an approved increase. Use a project status report to communicate delivery risks and decisions. A positive financial calculation does not establish client approval or completion.
Copyable project review checklist
Project and client:
Review date and period:
Currency and billing basis:
Recorded hours checked against tasks:
Cost-rate source and effective date:
Bill-rate source and effective date:
Rate-based work value:
Labor cost basis:
Direct expenses included once:
Invoice totals, statuses and payments checked separately:
Remaining work and estimated cost:
Overhead/tax/write-offs excluded or included explicitly:
Decision, owner and next review date:
For a client with several engagements, roll up the checked project figures using the client-profitability method. To review how much available time went into eligible client work, use the separate billable-utilization calculation. Neither calculation replaces the other.